Order updates - Explanation
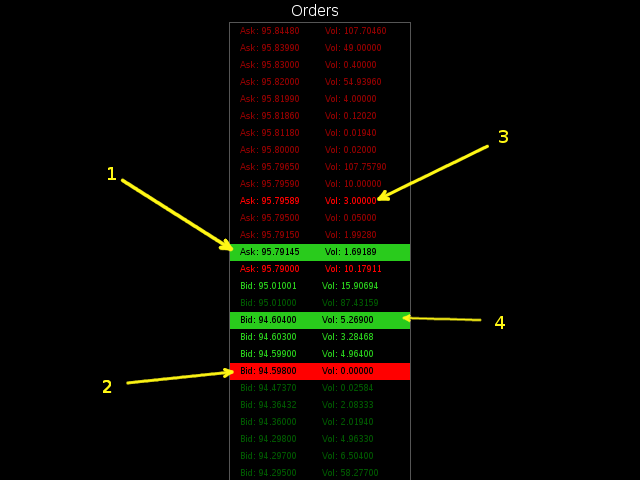
The orders column updates as orders are removed, added and changed. In the above example we can see :
1) The number of coins for sale at 95.79145 has decreased, allowing the price to rise more easily. A red highlighted Ask means that the number of coins for sale at that price has increased, resulting in downward pressure on the price.
2) The number of coins wanted at 94.59800 has decreased, there is now less support for the price at this level. In this case the number is now 0 and the row will shortly be removed.
3) An order updated in the last minute.
4) The number of coins wanted at 94.60400 has increased resulting in upward pressure on the price.
If you have any questions, comments or suggestions you can contact me @BTCticker on twitter.
Depth Graph - Explanation
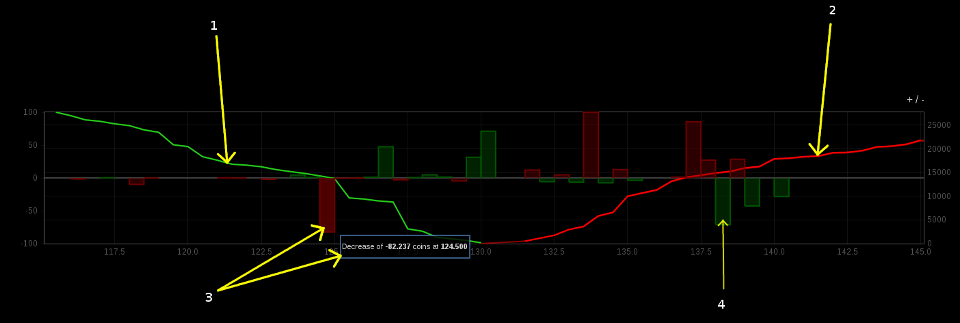
The depth graph shows you the cumulative depth for bid and sell orders currently on the market. It is useful to see the buy and sell pressure on the current price. If there is little support, the price will fall easily. As the price rises, orders may be removed from the market, allowing the price to rise with little opposition. In the above image we can see:
1) The cumulative depth for the buy orders on the market. If you hover over this, it will tell you the number of coins it would take to be sold to buy orders to reach this value.
2) The cumulative depth for the sell orders on the market. If you hover over this, it will tell you the number of coins it would take to be bought from sell orders to reach this price.
3) The number of coins wanted at 124.500 has dropped by 82.237. As a result, the support at this price is reduced.
4) The number of coins for sale at this price has reduced, allowing the price to rise more easily at this point.
If you have any questions, comments or suggestions you can contact me @BTCticker on twitter.